Marketing Analytics & Forecasting for B2B SaaS
Most marketing dashboards at $1M–$10M ARR run on platform-default attribution and six-month-old data. Most marketing forecasts are aspirations dressed up in math — built once a year, never reconciled against actuals. That's the gap this section closes. Operator-grade analytics means knowing which channel drove pipeline this week, not which channel got credited by last-click. Operator-grade forecasting means a model your CFO can defend line-by-line, updated monthly, reconciled to variance. The discipline isn't a six-week BI project — it's a Friday afternoon decision framework. Start with the forecasting article if your board questions assumptions, or the analytics article if your team is making decisions on stale numbers.

Four Funnel Stages, One Metric Each, and Where the Money Leaks
Ten thousand sessions produce three customers. Doubling traffic and doubling the money-page conversion rate both get you six, but one costs a doubled media budget every month and the other costs a week of work once.
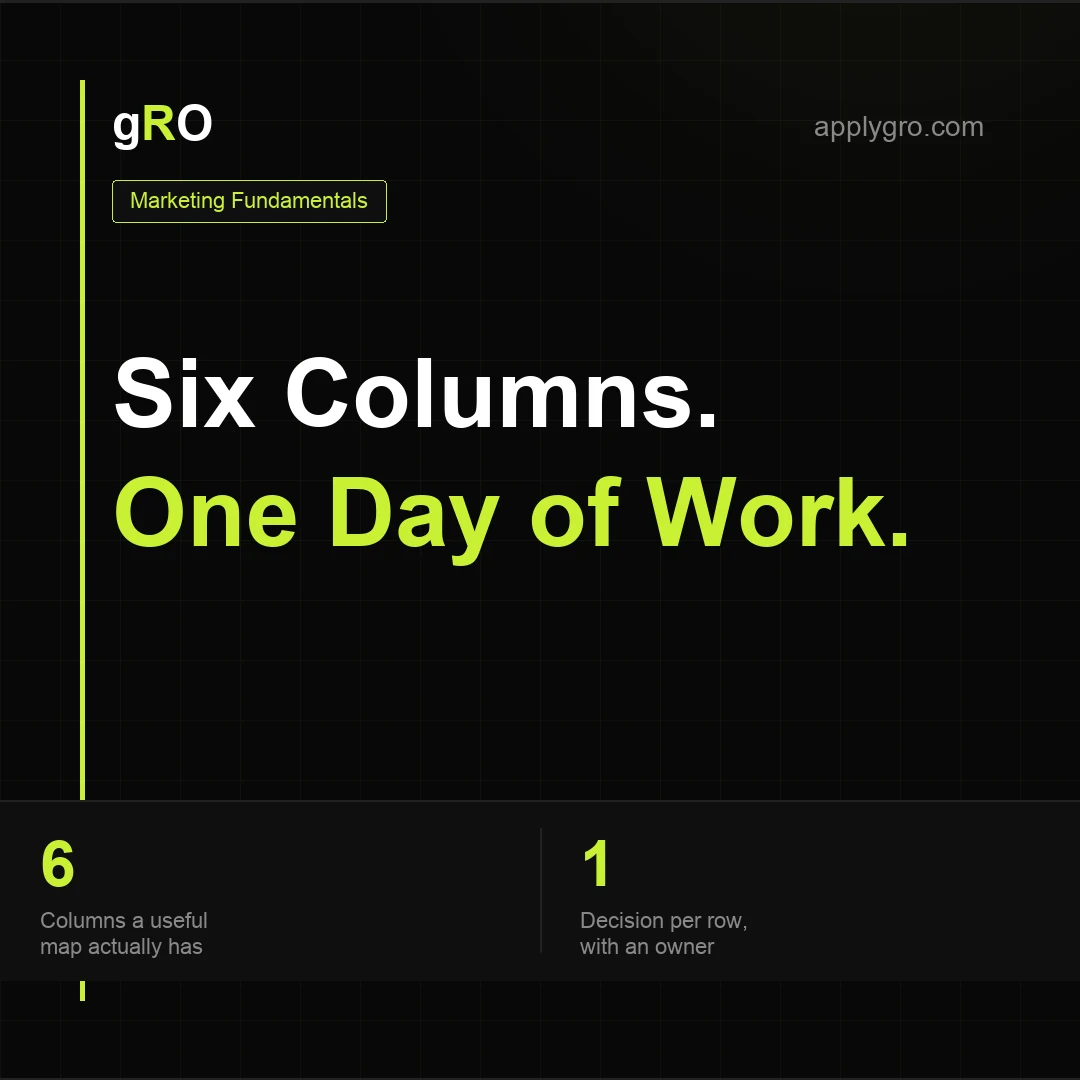
A Customer Journey Map That Changes What You Ship Next Week
Six columns, one day, and evidence pulled before anyone opens a whiteboard. Most maps die because they cover every customer type at once, run on assumptions, and give no gap an owner.
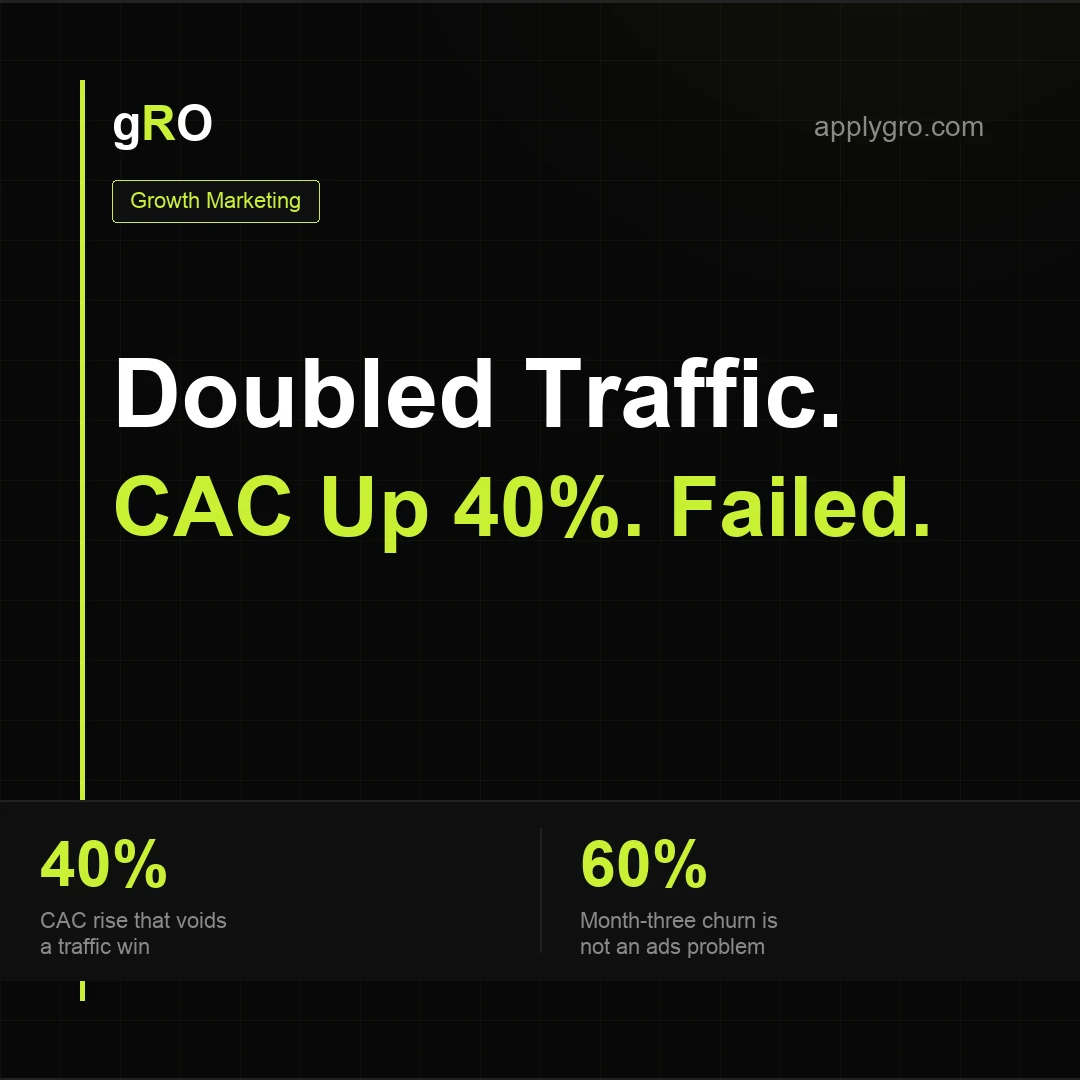
Growth Marketing, Defined by Someone Who Owns the Number
Most definitions were written by people who have never carried a pipeline number. A campaign that doubled traffic while CAC rose 40% is a failed campaign in this discipline, full stop.
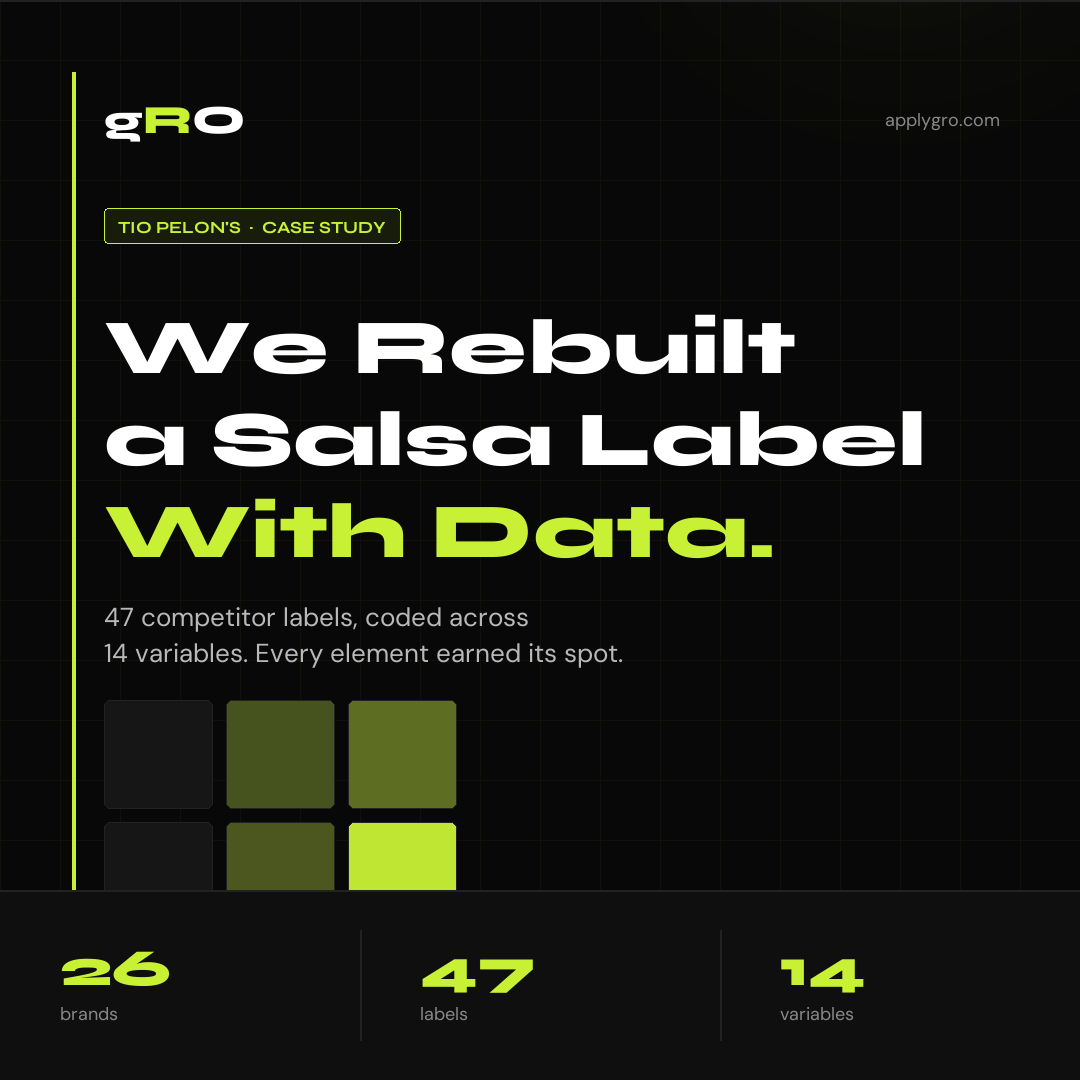
How We Redesigned a Salsa Label Against 47 Competitors
26 competitor brands pulled off the H-E-B shelf, 47 labels coded across 14 design variables, and one unclaimed position nobody had taken. How gRO rebuilt a San Antonio salsa brand's packaging on category data instead of taste.
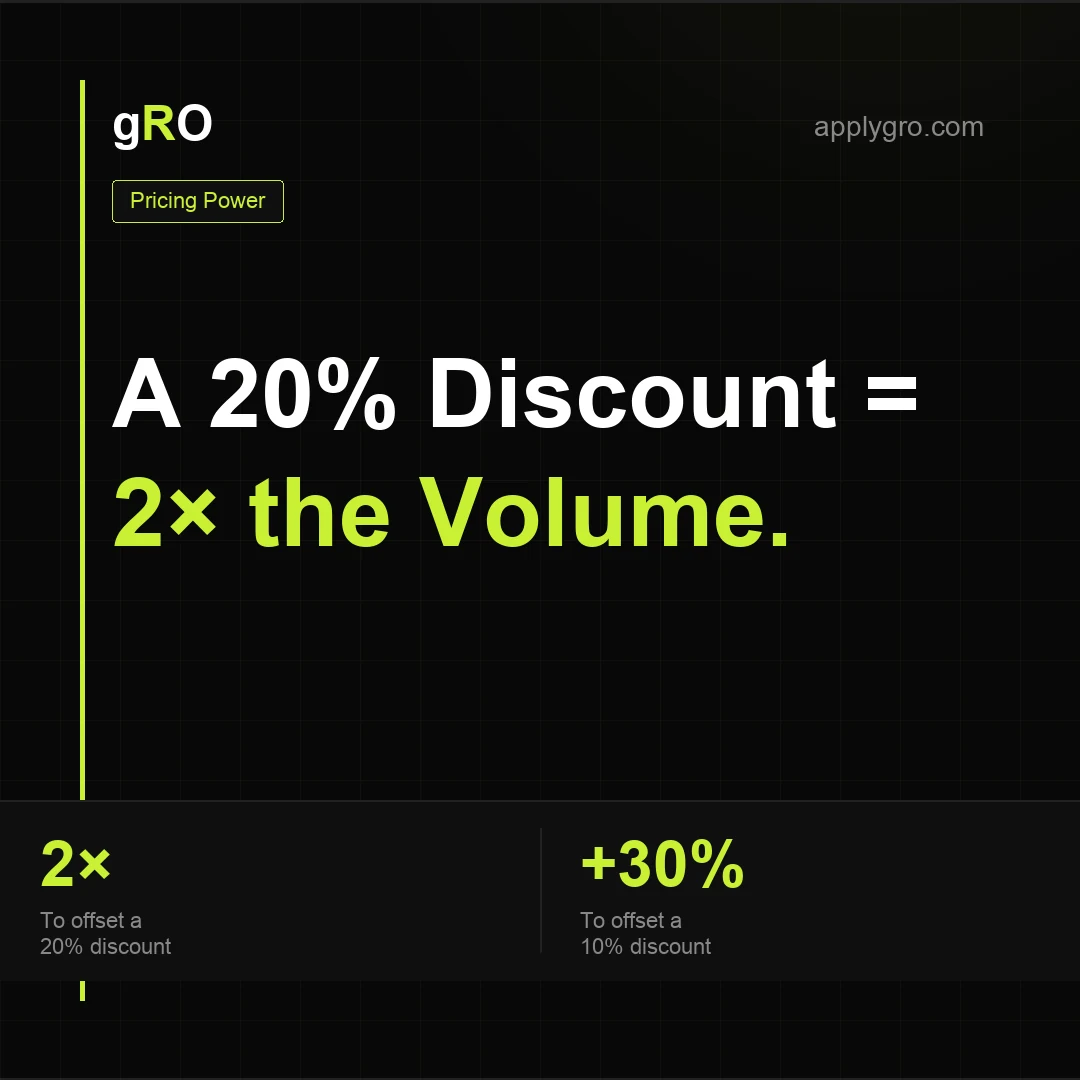
A 20% Discount Means Selling 67% More.
At a 50% gross margin, a 20% discount forces you to sell 67% more just to break even on profit — push it to 25% and you're selling double. Every discount trains buyers to wait. The contribution-margin math.
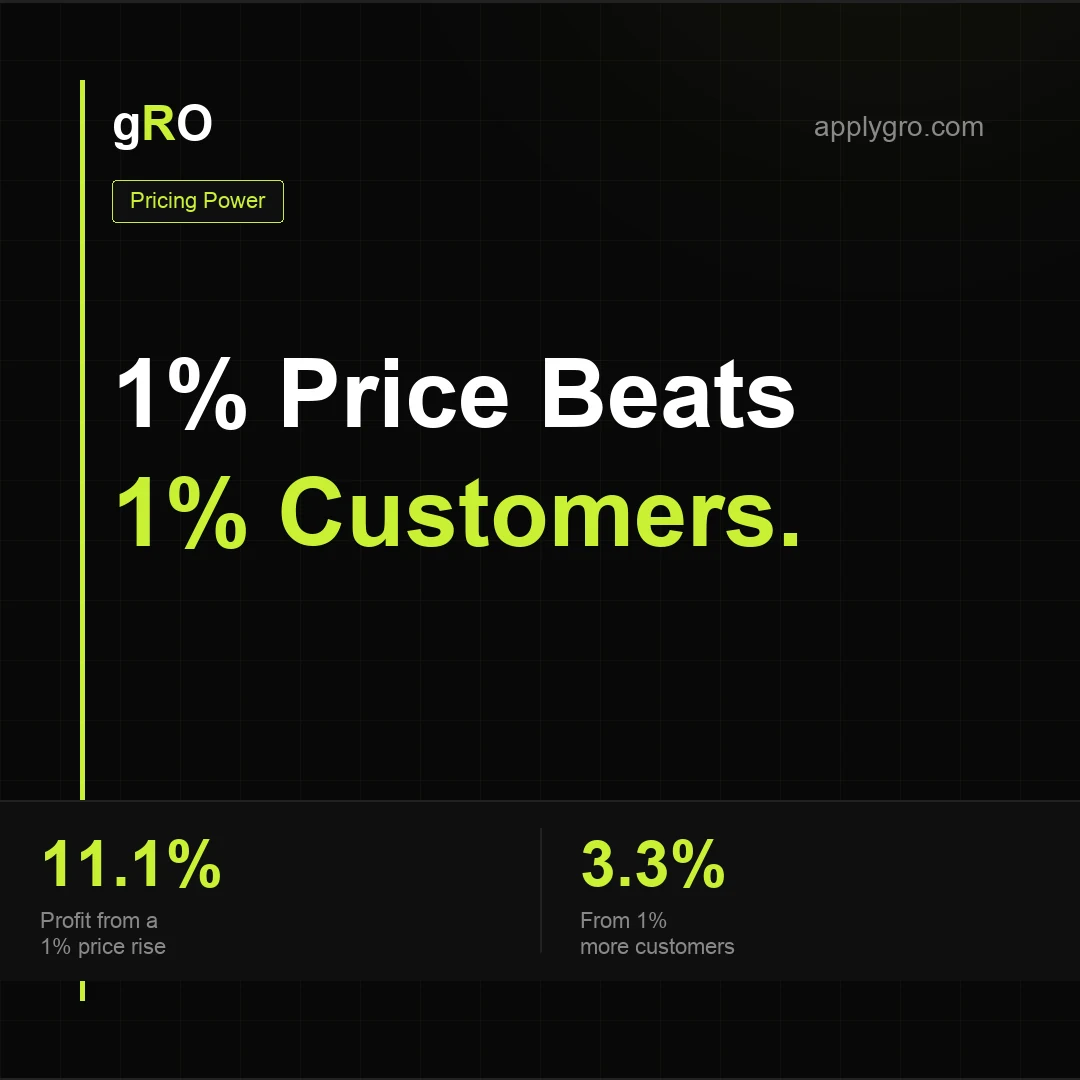
A 1% Price Increase Beats 1% More Customers.
The classic McKinsey finding: a 1% price increase raises operating profit 11.1%, vs ~3.3% from a 1% gain in customers. Why founders under-use the most powerful lever they have.
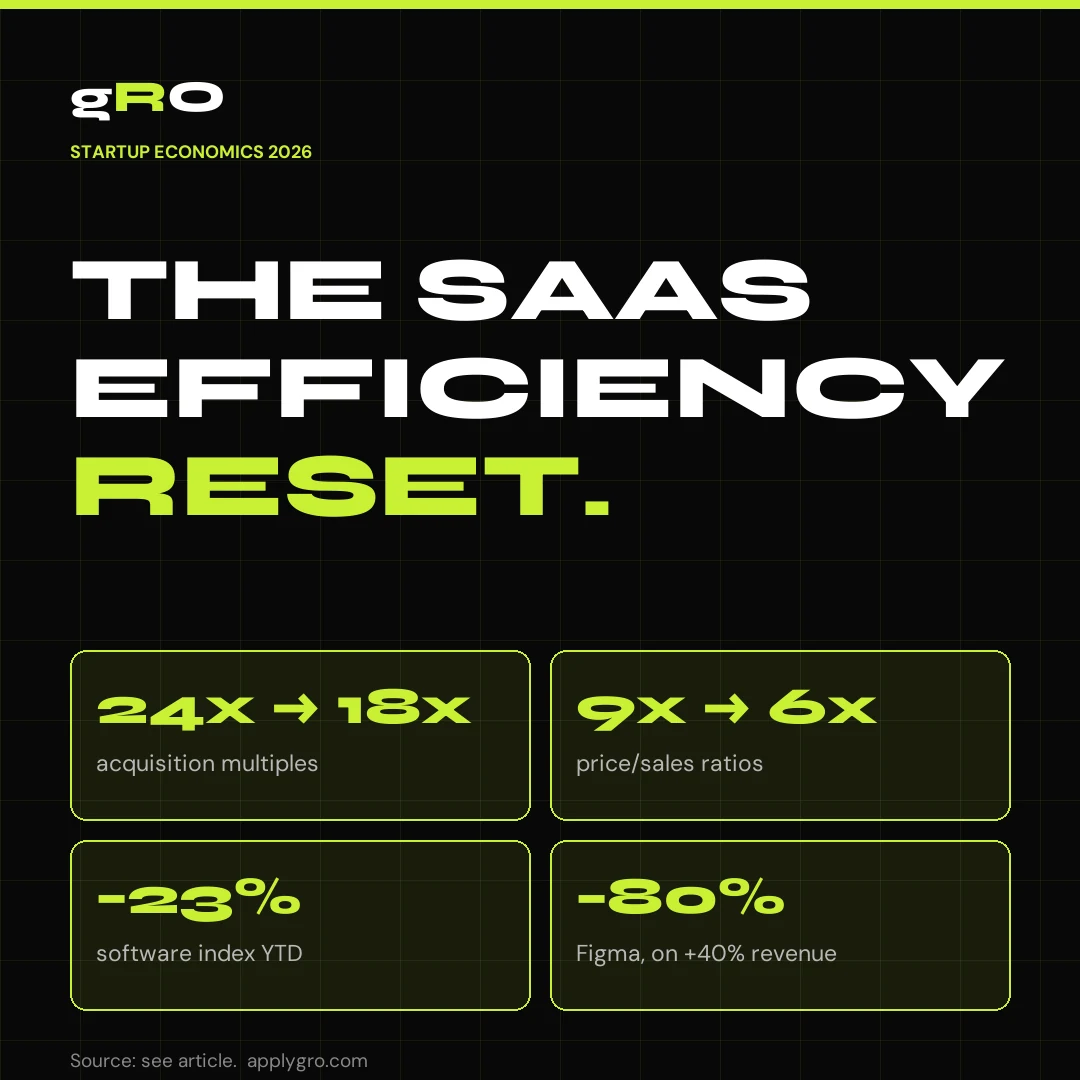
The SaaS Efficiency Reset.
SaaS multiples fell 24x→18x; price/sales compressed 9x→6x; Figma dropped 80% while growing revenue 40%. The market changed the question from how fast you grow to how efficiently. Where your next dollar compounds now.
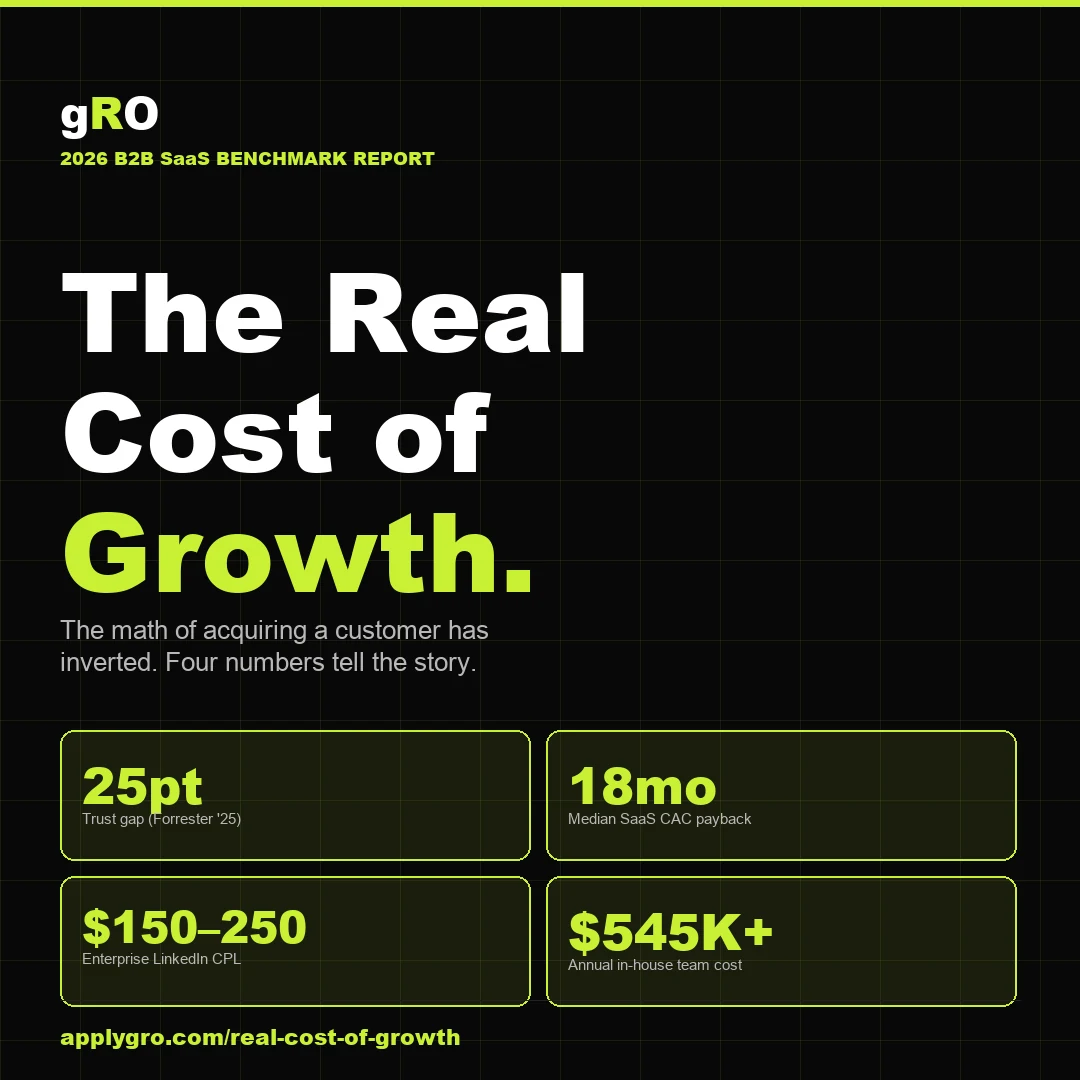
The Real Cost of Growth: Why $1M–$10M ARR Founders Are Paying More for Less.
A 2026 B2B SaaS benchmark report. Why the math of acquiring a customer has inverted — 25-pt trust gap, 18-mo CAC payback, $150–250 enterprise CPL, $408K+ in-house team cost — and the operator-led model rewriting it. Every benchmark independently sourced. Includes the free PDF.
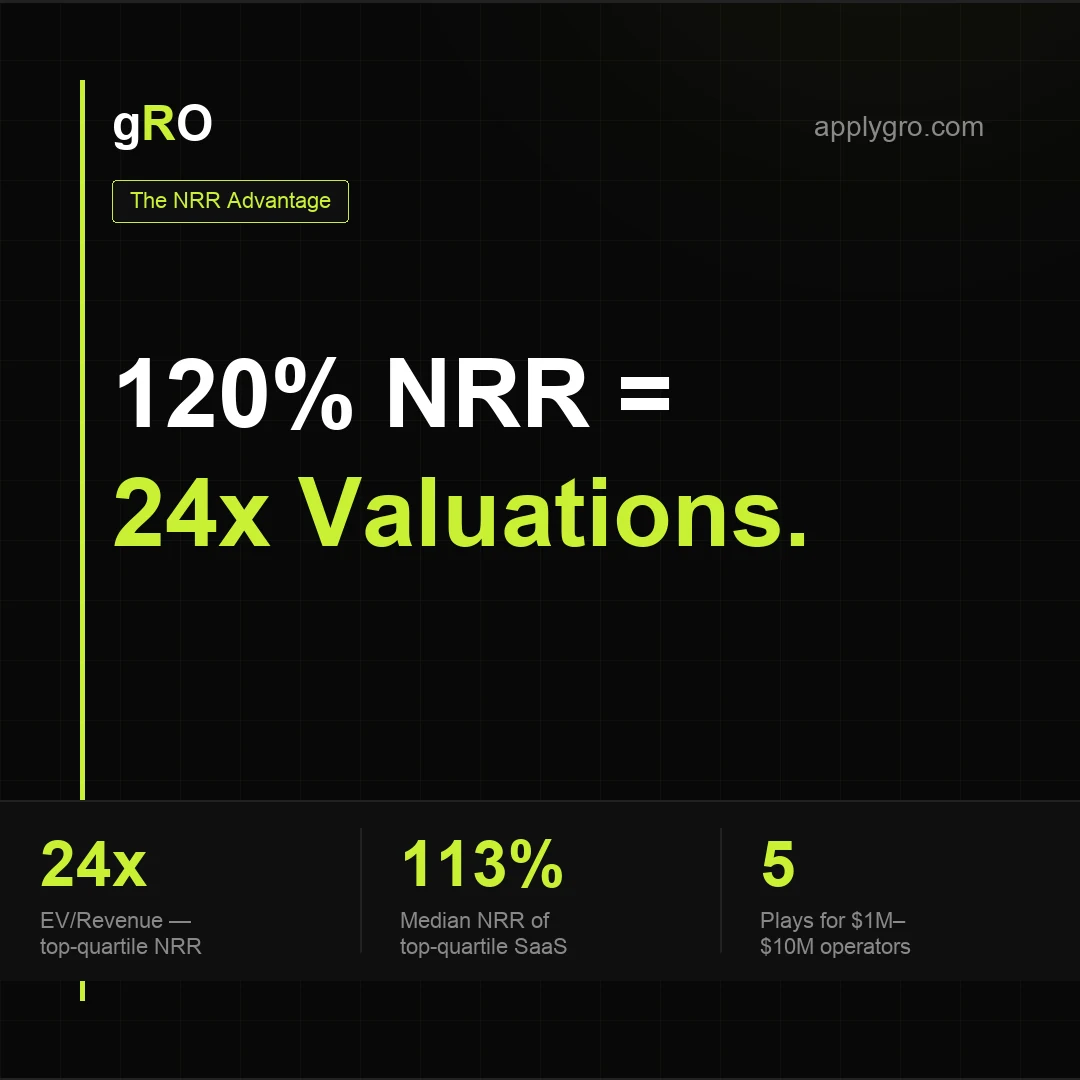
How 120% NRR SaaS Companies Get 24x Valuations.
McKinsey decoded for operators. Top-quartile NRR B2B SaaS trades at 24x revenue while bottom-quartile sits at 5x. The 9 practices, the 5 plays, and the operator playbook. Includes the 7-minute video.
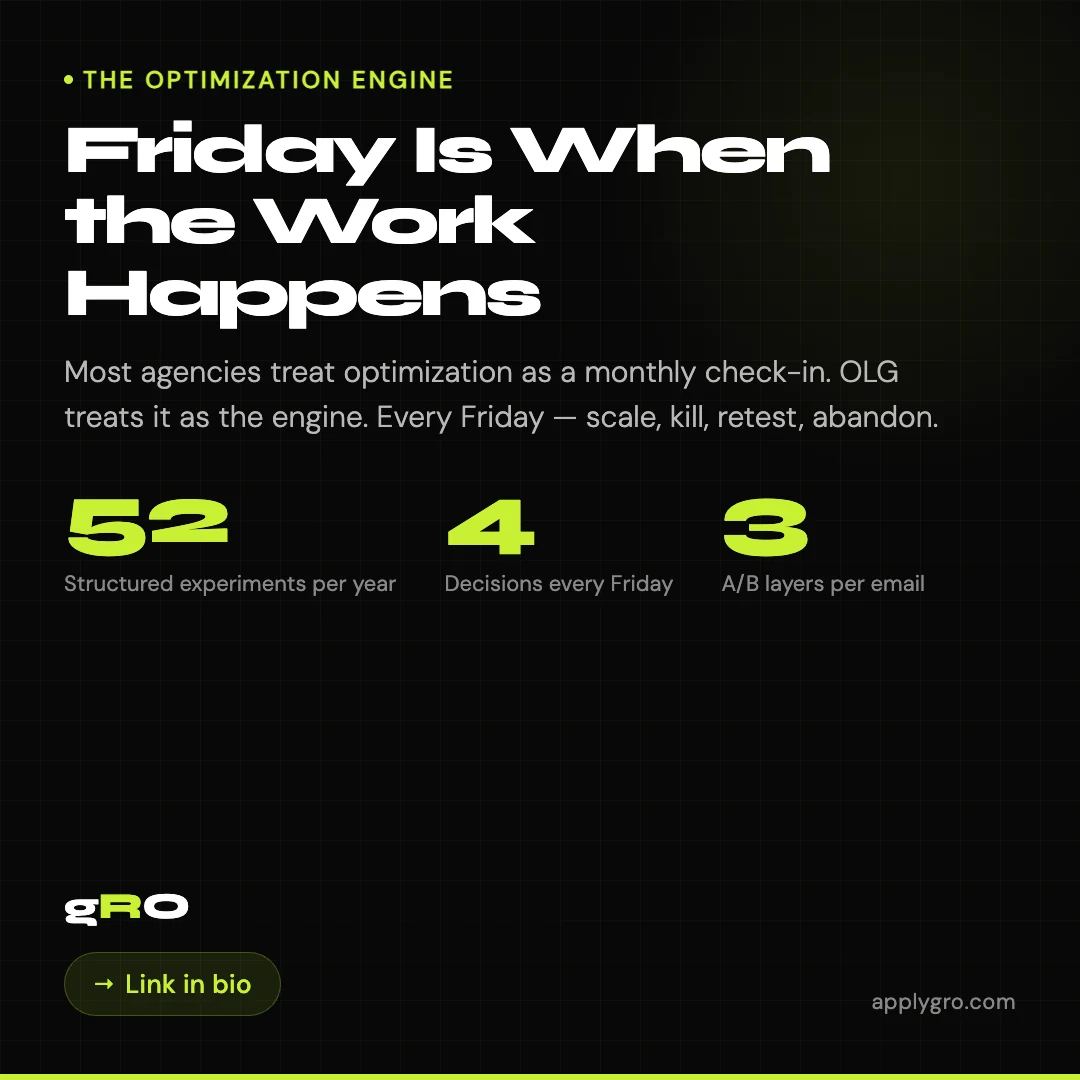
Friday Is When the Work Happens.
Most agencies treat optimization as a monthly check-in. Operator-Led Growth treats it as the engine. Every Friday — scale, kill, retest, abandon.
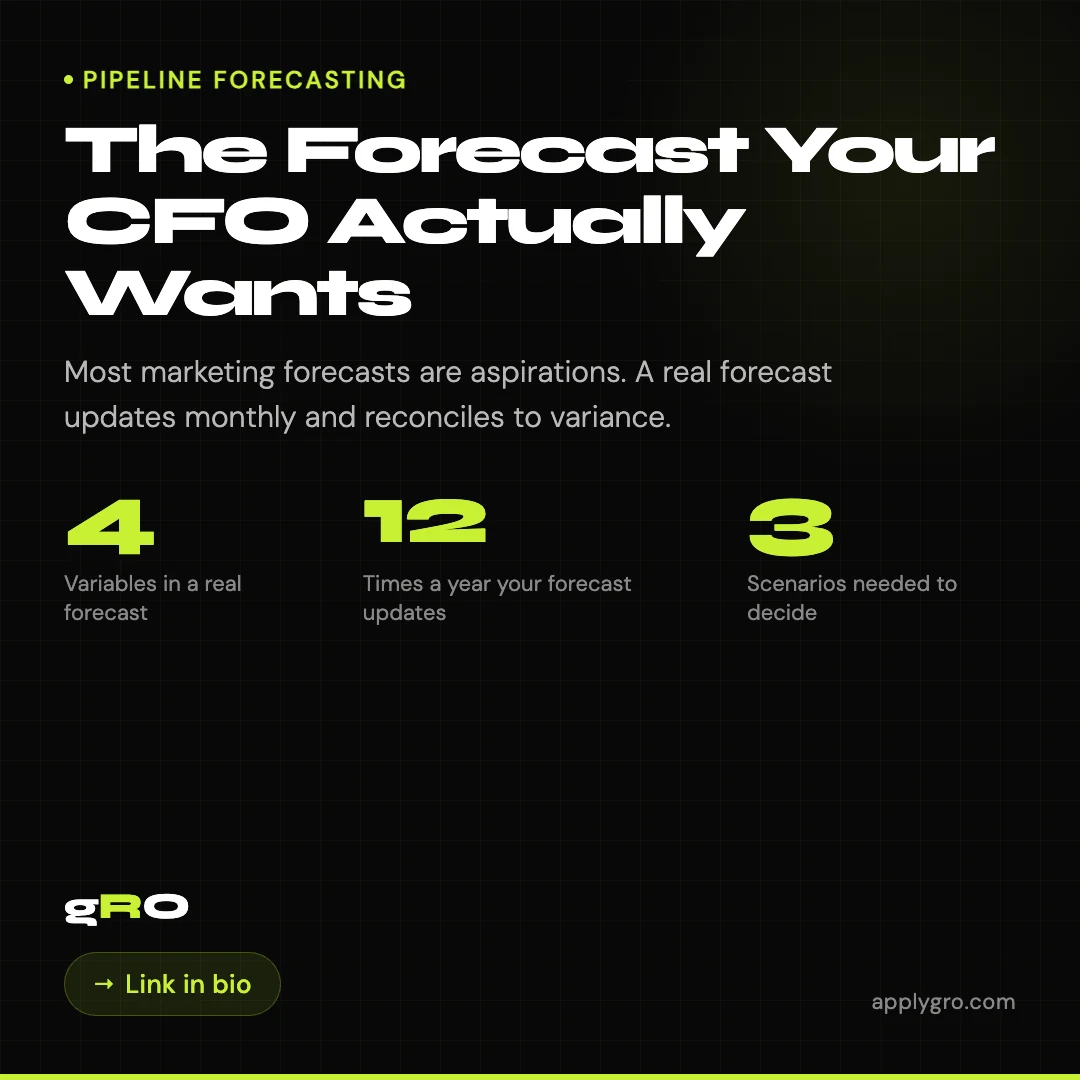
The Forecast Your CFO Actually Wants.
Most marketing forecasts are aspirations dressed up in math. A real forecast updates monthly, reconciles to variance, and survives a CFO's line-item review.

Your Dashboard Is Lying to You.
Most dashboards report platform-default attribution on six-month-old data. The fix isn't a six-week project — it's a Friday afternoon.

Revenue Bands to Lead Scores: The 25 / 10 / −10 / 0 Rubric.
In-ICP revenue band: +25. Adjacent: +10. Out-of-band: −10. Unknown: 0, never negative. The four-number firmographic rubric, how a nine-band vendor ladder from $0–1M to $200M+ collapses into it with first-match rules (SQL, JavaScript, Sheets), a scorer for your own bands, and a free 22-page field guide.
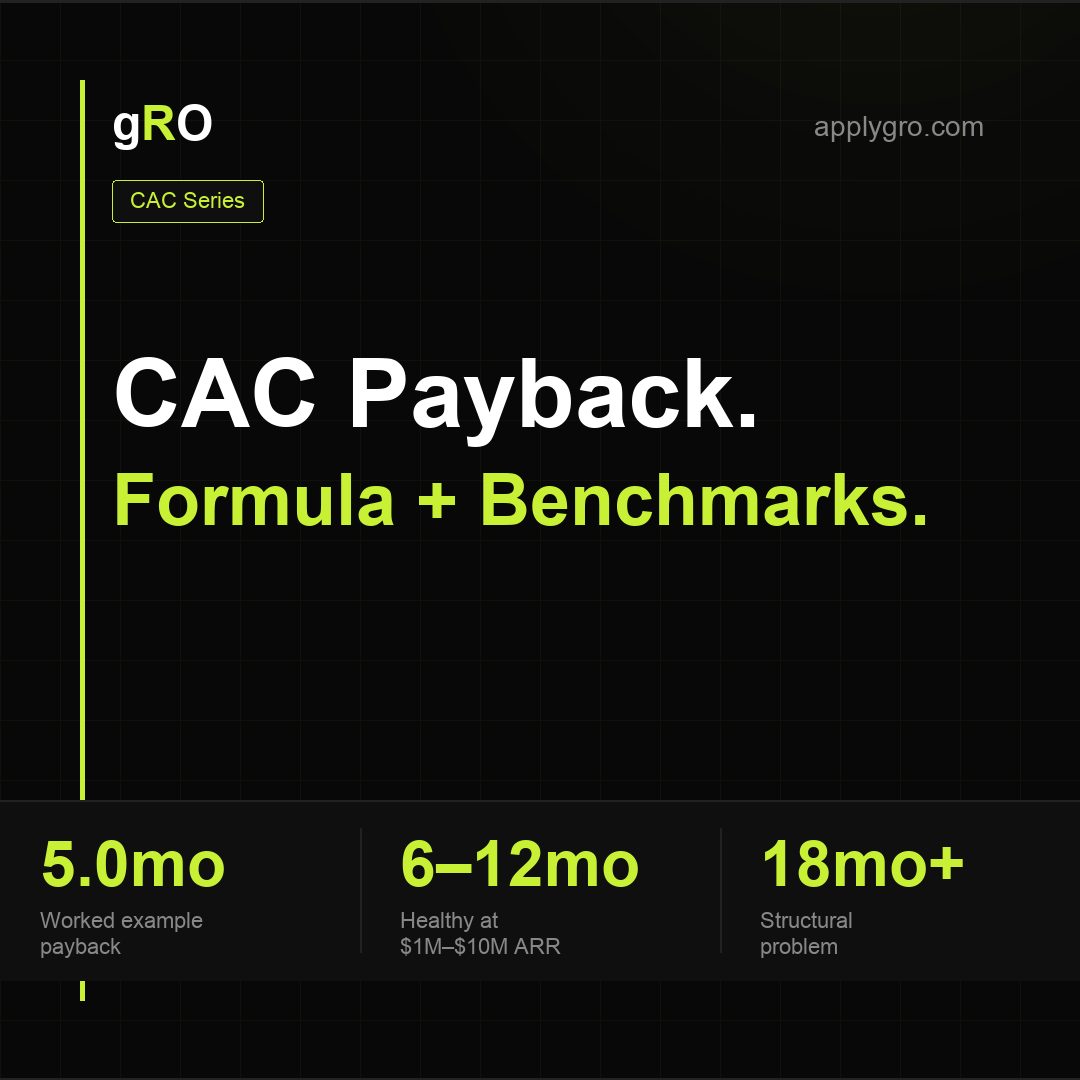
SaaS CAC Payback Period: Formula & Benchmarks by Stage.
CAC ÷ monthly gross profit per customer = payback in months. A worked example at $4M ARR, healthy ranges by ARR stage, and the three structural drivers — ACV, CAC, gross margin — that actually compress it.